Setting up Cluster on Kubernetes
Kubernetes is an open source project designed for container orchestration. TIBCO ComputeDB can be deployed on Kubernetes.
The following sections are included in this topic:
Prerequisites
The following prerequisites must be met to deploy TIBCO ComputeDB on Kubernetes:
-
Kubernetes cluster A running Kubernetes cluster of version 1.9 or higher. TIBCO ComputeDB has been tested on Google Container Engine(GKE) as well as on Pivotal Container Service (PKS). If Kubernetes cluster is not available, you can set it up as mentioned here.
-
Helm tool Helm tool must be deployed in the Kubernetes environment. You can follow the instructions here to deploy Helm in your Kubernetes enviroment.
- Docker image Helm charts use Docker image to launch the TIBCO ComputeDB cluster on Kubernetes. You can refer to these steps to build and publish your Docker image for TIBCO ComputeDB. TIBCO does not provide a Docker image for TIBCO ComputeDB.
Getting Access to Kubernetes Cluster
If you would like to deploy Kubernetes on-premises, you can use any of the following options:
Option 1 - PKS
- PKS on vSphere: Follow these instructions
- PKS on GCP: Follow these instructions
- Create a Kubernetes cluster using PKS CLI : After PKS is setup you will need to create a Kubernetes cluster as described here
Option 2 - Google Cloud Platform (GCP)
- Login to your Google account and go to the Cloud console to launch a GKE cluster.
Steps to perform after Kubernetes cluster is available:
- If using PKS, you must install the PKS command line tool. See instructions here.
- Install
kubectlon your local development machine and configure access to the kubernetes/PKS cluster. See instructions forkubectlhere. - If you are using Google cloud, you will find instructions for setting up Google Cloud SDK ('gcloud') along with
kubectlhere.
Deploying TIBCO ComputeDB on Kubernetes
SnappyData Helm chart is used to deploy TIBCO ComputeDB on Kubernetes. It uses Kubernetes statefulsets to launch the locator, lead, and server members.
To deploy TIBCO ComputeDB on Kubernetes:
-
Clone the spark-on-k8s repository and change to charts directory.
git clone https://github.com/SnappyDataInc/spark-on-k8s cd spark-on-k8s/charts -
Edit the snappydata > values.yaml file to configure in the SnappyData Chart. Specify the details of your TIBCO ComputeDB Docker image as mentioned in the example below. Replace values for image and tag appropriatly with your Dockerhub registry name, image name and tag.
    image: your-dockerhub-registry/snappydata-docker-image
    imageTag: 1.2
    imagePullPolicy: IfNotPresent
To pull a Docker image from a private registry, create a secret by following steps as mentioned here and specify the name of the secret in values.yaml as shown below. Note that, the secret must be created in the namespace in which TIBCO ComputeDB will be deployed (namespace "snappy" in this case)
imagePullSecrets: secretName -
Optionally, you can edit the TIBCO ComputeDB > values.yaml file to change the default configurations in the SnappyData Chart. Configurations can be specified in the respective attributes for locators, leaders, and servers in this file. Refer List of Configuration Parameters for SnappyData Chart
-
Install the TIBCO ComputeDB chart using the following command:
helm install --name snappydata --namespace snappy ./snappydata/The above command installs the SnappyData chart in a namespace called snappy and displays the Kubernetes objects (service, statefulsets etc.) created by the chart on the console. By default, SnappyData Helm chart deploys a TIBCO ComputeDB cluster which consists of one locator, one lead, two servers and services to access TIBCO ComputeDB endpoints.
You can monitor the Kubernetes UI dashboard to check the status of the components as it takes few minutes for all the servers to be online. To access the Kubernetes UI refer to the instructions here.
SnappyData chart dynamically provisions volumes for servers, locators, and leads. These volumes and the data in it are retained even after the chart deployment is deleted.
Interacting with TIBCO ComputeDB Cluster on Kubernetes
You can interact with the TIBCO ComputeDB cluster on Kuberenetes in the same manner as you interact with a TIBCO ComputeDB cluster that runs locally or on-premise. All you require is the host IP address of the locator and the lead with their respective ports numbers.
To find the IP addresses and port numbers of the TIBCO ComputeDB processes, use command kubectl get svc --namespace=snappy.
In the output, three services namely snappydata-leader-public, snappydata-locator-public and
snappydata-server-public of type LoadBalancer are seen which expose the endpoints for locator, lead, and server respectively. These services have external IP addresses assigned and therefore can be accessed from outside Kubernetes. The remaining services that do not have external IP addresses are those that are created for internal use.
snappydata-leader-public service exposes port 5050 for TIBCO ComputeDB Monitoring Console, port 10000 for Hive Thrift server and port 8090 to accept TIBCO ComputeDB jobs. snappydata-locator-public service exposes port 1527 to accept JDBC/ODBC connections.
You can do the following on the TIBCO ComputeDB cluster that is deployed on Kubernetes:
Accessing TIBCO ComputeDB Monitoring Console
The dashboards on the TIBCO ComputeDB Monitoring Console can be accessed using snappydata-leader-public service. To view the dashboard, type the URL in the web browser in the format: externalIp:5050. Replace externalip with the external IP address of the snappydata-leader-public service.
To access TIBCO ComputeDB Monitoring Console in Kubernetes:
-
Check the TIBCO ComputeDB services running in the Kubernetes cluster.
kubectl get svc --namespace=snappyThe output displays the external IP address of the snappydata-leader-public service as shown in the following image: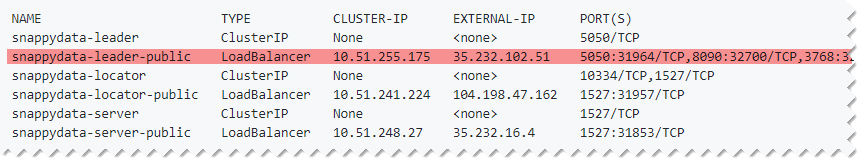
-
Type externalIp:5050 in the browser. Here you must replace externalip with the external IP address of the leader-public service. For example, 35.232.102.51:5050.
Connecting TIBCO ComputeDB Using JDBC Driver
For Kubernetes deployments, JDBC clients can connect to TIBCO ComputeDB cluster using the JDBC URL that is derived from the snappydata-locator-public service.
To connect to TIBCO ComputeDB using JDBC driver in Kubernetes:
-
Check the TIBCO ComputeDB services running in Kubernetes cluster.
kubectl get svc --namespace=snappyThe output displays the external IP address of the snappydata-locator-public service and the port number for external connections as shown in the following image: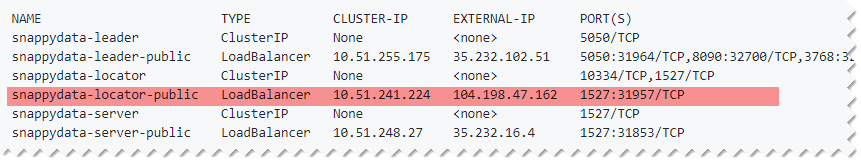
-
Use the external IP address and port of the snappydata-locator-public services to connect to TIBCO ComputeDB cluster using JDBC connections. For example, based on the above output, the JDBC URL to be used will be jdbc:snappydata://104.198.47.162:1527/
You can refer to TIBCO ComputeDB documentation for an example of JDBC program and for instructions on how to obtain JDBC driver using Maven/SBT co-ordinates.
Executing Queries Using Snappy Shell
You can use Snappy shell to connect to TIBCO ComputeDB and execute your queries. You can simply connect to one of the pods in the cluster and use the Snappy Shell. Alternatively, you can download the TIBCO ComputeDB distribution from github releases. Snappy shell need not run within the Kubernetes cluster.
To execute queries in Kubernetes deployment:
-
Check the TIBCO ComputeDB services running in the Kubernetes cluster.
kubectl get svc --namespace=snappyThe output displays the external IP address of the snappydata-locator-public services and the port number for external connections as shown in the following image: -
Launch Snappy shell and then create tables and execute queries. Following is an example of executing queries using Snappy shell.
# Connect to snappy-shell
 bin/snappy
 snappy> connect client '104.198.47.162:1527';

# Create tables and execute queries
 snappy> create table t1(col1 int, col2 int) using column;
 snappy> insert into t1 values(1, 1);
 1 row inserted/updated/deleted
Submitting a TIBCO ComputeDB Job
Refer to the How Tos section in TIBCO ComputeDB documentation to understand how to submit TIBCO ComputeDB jobs. However, for submitting a TIBCO ComputeDB job in Kubernetes deployment, you need to use the snappydata-leader-public service that exposes port 8090 to run the jobs.
To submit a TIBCO ComputeDB job in Kubernetes deployment:
-
Check the TIBCO ComputeDB services running in Kubernetes cluster.
kubectl get svc --namespace=snappyThe output displays the external IP address of snappydata-leader-public service which must be noted. -
Change to TIBCO ComputeDB product directory.
cd $SNAPPY_HOME -
Submit the job using the external IP of the snappydata-leader-public service and the port number 8090 in the --lead option. Following is an example of submitting a Snappy Job:
bin/snappy-job.sh submit
--app-name CreatePartitionedRowTable
  --class org.apache.spark.examples.snappydata.CreatePartitionedRowTable
  --app-jar examples/jars/quickstart.jar
  --lead 35.232.102.51:8090
Stopping the TIBCO ComputeDB Cluster on Kubernetes
To stop the TIBCO ComputeDB cluster on Kubernetes, you must delete the SnappyData Helm chart using the helm delete command.
$ helm delete --purge snappydata
The dynamically provisioned volumes and the data in it is retained, even if the chart deployment is deleted.
Note
If the chart is deployed again with the same chart name and if the volume exists, then the existing volume is used instead of provisioning a new volume.
List of Configuration Parameters for SnappyData Chart
You can modify the values.yaml file to configure the SnappyData chart. The following table lists the configuration parameters available for this chart:
| Parameter | Description | Default |
|---|---|---|
image |
Docker repo from which the TIBCO ComputeDB Docker image is pulled. | snappydatainc/snappydata |
imageTag |
Tag of the TIBCO ComputeDB Docker image that is pulled. | |
imagePullPolicy |
Pull policy for the image. | IfNotPresent |
imagePullSecrets |
Secret name to be used to pull image from a private registry | |
locators.conf |
List of the configuration options that is passed to the locators. | |
locators.resources |
Resource configuration for the locator Pods. User can configure CPU/memory requests and limit the usage. | locators.requests.memory is set to 1024Mi. |
locators.persistence.storageClass |
Storage class that is used while dynamically provisioning a volume. | Default value is not defined so default storage class for the cluster is chosen. |
locators.persistence.accessMode |
Access mode that is used for the dynamically provisioned volume. | ReadWriteOnce |
locators.persistence.size |
Size of the dynamically provisioned volume. | 10Gi |
servers.replicaCount |
Number of servers that are started in a TIBCO ComputeDB cluster. | 2 |
servers.conf |
List of the configuration options that are passed to the servers. | |
servers.resources |
Resource configuration for the server Pods. You can configure CPU/memory requests and limit the usage. | servers.requests.memory is set to 4096Mi |
servers.persistence.storageClass |
Storage class that is used while dynamically provisioning a volume. | Default value is not defined so default storage class for the cluster will be chosen. |
servers.persistence.accessMode |
Access mode for the dynamically provisioned volume. | ReadWriteOnce |
servers.persistence.size |
Size of the dynamically provisioned volume. | 10Gi |
leaders.conf |
List of configuration options that can be passed to the leaders. | |
leaders.resources |
Resource configuration for the server pods. You can configure CPU/memory requests and limits the usage. | leaders.requests.memory is set to 4096Mi |
leaders.persistence.storageClass |
Storage class that is used while dynamically provisioning a volume. | Default value is not defined so default storage class for the cluster will be chosen. |
leaders.persistence.accessMode |
Access mode for the dynamically provisioned volume. | ReadWriteOnce |
leaders.persistence.size |
Size of the dynamically provisioned volume. | 10Gi |
The following sample shows the configuration used to start four servers each with a heap size of 2048 MB:
servers:
  replicaCount: 4
  ## config options for servers
  conf: "-heap-size=2048m"
You can specify TIBCO ComputeDB configuration parameters in the servers.conf, locators.conf, and leaders.conf attributes for servers, locators, and leaders respectively.
Kubernetes Obects Used in SnappyData Chart
This section provides details about the following Kubernetes objects that are used in SnappyData Chart:
Statefulsets for Servers, Leaders, and Locators
Kubernetes statefulsets are used to manage stateful applications. Statefulsets provide many benefits such as stable and unique network identifiers, stable persistent storage, ordered deployment and scaling, graceful deletion, and rolling updates. SnappyData Helm chart deploys statefulsets for servers, leaders, and locators. By default the chart deploys two data servers, one locator, and one leader. Upon deletion of the Helm deployment, each pod gracefully terminates the process that is running on it.
Services that Expose External Endpoints
SnappyData Helm chart creates services to allow you to make JDBC connections, execute Spark jobs, and access
TIBCO ComputeDB Monitoring Console etc. Services of the type LoadBalancer have external IP address assigned and can be used to connect from outside of Kubernetes cluster.
To check the service created for TIBCO ComputeDB deployment, use command kubectl get svc --namespace=snappy. The following output is displayed:
NAME                        TYPE           CLUSTER-IP      EXTERNAL-IP      PORT(S)                                        AGE
snappydata-leader           ClusterIP      None            <none>           5050/TCP                                       5m
snappydata-leader-public    LoadBalancer   10.51.255.175   35.232.102.51    5050:31964/TCP,8090:32700/TCP,3768:32575/TCP   5m
snappydata-locator          ClusterIP      None            <none>           10334/TCP,1527/TCP                             5m
snappydata-locator-public   LoadBalancer   10.51.241.224   104.198.47.162   1527:31957/TCP                                 5m
snappydata-server           ClusterIP      None            <none>           1527/TCP                                       5m
snappydata-server-public    LoadBalancer   10.51.248.27    35.232.16.4      1527:31853/TCP                                 5m
In the above output, three services namely snappydata-leader-public, snappydata-locator-public and snappydata-server-public of type LoadBalancer are created. These services have external IP addresses assigned and therefore can be accessed from outside Kubernetes. The remaining services that do not have external IP addresses are those that are created for internal use.
snappydata-leader-public service exposes port 5050 for TIBCO ComputeDB Monitoring Console and port 8090 to accept Snappy jobs. snappydata-locator-public service exposes port 1527 to accept JDBC connections.
Persistent Volumes
A pod in a TIBCO ComputeDB deployment has a persistent volume mounted on it. This volume is dynamically provisioned and is used
to store data directory for TIBCO ComputeDB. On each pod, the persistent volume is mounted on path /opt/snappydata/work. These volumes and the data in it is retained even if the chart deployment is deleted.
Accessing Logs
You can access the logs when the TIBCO ComputeDB cluster is running as well as when the TIBCO ComputeDB cluster is not running.
Accessing Logs When TIBCO ComputeDB Cluster is Running
When a TIBCO ComputeDB cluster is running, you can open a session for a pod using kubectl command and then view the logs.
The following example shows how to access logs of snappydata-server-0:
# Connect to snappydata-server-0 pod and open a shell.
$ kubectl exec -it snappydata-server-0 --namespace snappy -- /bin/bash

# Switch to TIBCO ComputeDB work directory and view the logs.
$ cd /opt/snappydata/work
$ ls
Accessing Logs When TIBCO ComputeDB Cluster is not Running
When TIBCO ComputeDB cluster is not running, you can access the volumes used in TIBCO ComputeDB with a utility script snappy-debug-pod.sh located in the utils directory of Spark on k8s repository.
This script launches a pod in the Kubernetes cluster with persistent volumes, specified via --pvc option, mounted on it and then returns a shell prompt. Volumes are mounted on the path starting with /data0 (volume1 on /data0 and so on).
In the following example, the names of the persistent volume claims used by the cluster are retrieved and passed to the snappy-debug-pod.sh script to be mounted on the pod.
# Get the names of persistent volume claims used by TIBCO ComputeDB cluster installed in a namespace
# called *snappy*. The PVCs used by TIBCO ComputeDB are prefixed with 'snappy-disk-claim-'.

$ kubectl get  pvc --namespace snappy
NAME                                     STATUS    VOLUME                                     CAPACITY   ACCESS MODES   STORAGECLASS   AGE
snappy-disk-claim-snappydata-leader-0    Bound     pvc-17cf9834-68c3-11e8-ab38-42010a8001a3   10Gi       RWO            standard       50d
snappy-disk-claim-snappydata-locator-0   Bound     pvc-17d75411-68c3-11e8-ab38-42010a8001a3   10Gi       RWO            standard       50d
snappy-disk-claim-snappydata-server-0    Bound     pvc-17de4f1a-68c3-11e8-ab38-42010a8001a3   10Gi       RWO            standard       50d
snappy-disk-claim-snappydata-server-1    Bound     pvc-226d778d-68c3-11e8-ab38-42010a8001a3   10Gi       RWO            standard       50d

# To view logs for server-0 and server-1, use PVCs 'snappy-disk-claim-snappydata-server-0' and snappy-disk-claim-snappydata-server-1'

$ ./utils/snappy-debug-pod.sh --pvc snappy-disk-claim-snappydata-server-0,snappy-disk-claim-snappydata-server-1 --namespace snappy
Volume for snappy-disk-claim-snappydata-server-0 will be mounted on /data0
Volume for snappy-disk-claim-snappydata-server-1 will be mounted on /data1
Launching the POD
If you don't see a command prompt, try pressing enter.
bash-4.1#
In the above example, the second command opens a session with bash prompt for the pod on which the volumes corresponding to the mentioned PVCs are mounted on paths such as /data0, /data1 and so on.
You can then examine the logs in these mounted paths. For example:
bash-4.1# ls /data1
lost+found  members.txt  snappydata-server-1
bash-4.1# ls /data0
lost+found  members.txt  snappydata-server-0
bash-4.1# ls /data0/snappydata-server-0/
bash-4.1# ls /data0/snappydata-server-0/*.*log
Configuring the Log Level
You can provide a log4j.properties file while installing the SnappyData Helm chart. A template file log4j.properties.template is provided in the charts/snappydata/conf/ directory. This template file can be renamed and used to configure log level as shown in the following example:
$ cd charts/snappydata/conf/
# copy the template file and edit it to configure log level
$ cp log4j.properties.template log4j.properties
When SnappyData chart is installed, the log4.properties file will be used to configure the log level.
Mounting ConfigMaps
Files created in charts/snappydata/conf/ are mounted on TIBCO ComputeDB server, lead, and locator pods as configmaps and copied into the product's conf directory. This is useful to make configuration files (such as spark-env.sh, metrics.properties etc.) available to the product. Template files are provided in the charts/snappydata/conf/. These template files can be renamed and edited to provide configuration.
For example:
$ cd snappydata/conf/
$ cp spark-env.sh.template spark-env.sh
# now modify the spark-env.sh to specify configuration